You hear users complain about bad performance. You open the Unity Profiler, record a capture, check the TImeline and… your frame time graph looks like a heart attack.
And the worst part? You can stare at bars for hours and still “fix” the wrong thing. You ship a patch. The spike moves. Congrats. You optimized symptoms.
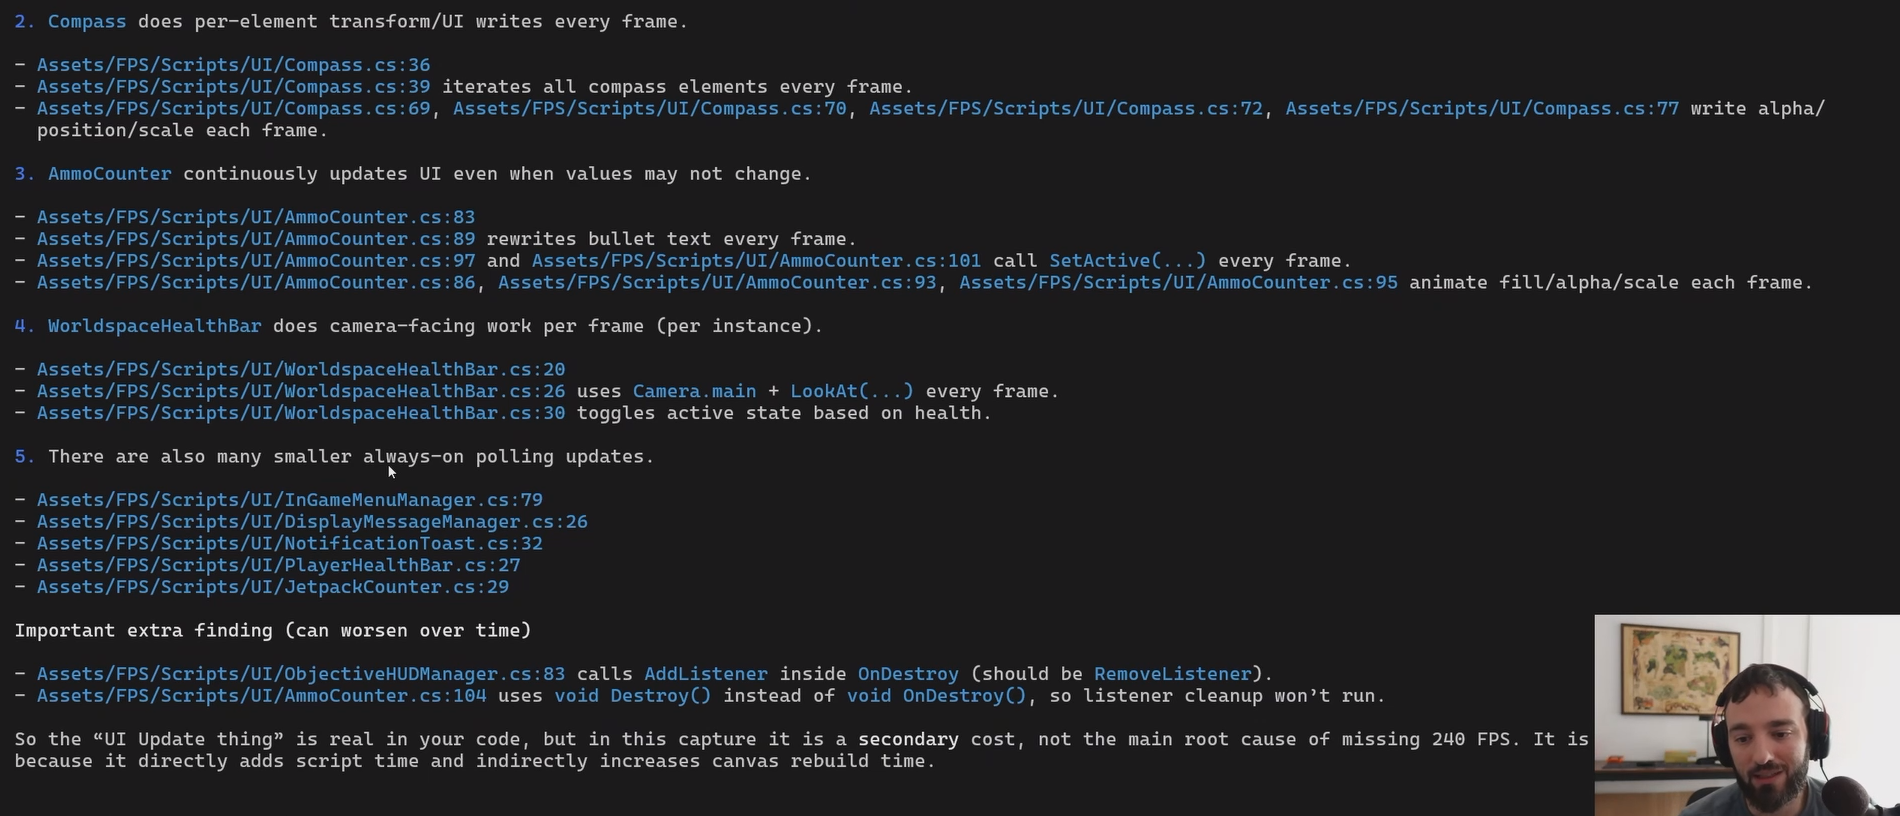
This module fixes that with an AI agent doing the root-cause work, locked in read-only mode so it analyzes your capture and never touches your repo.
The 80/20 workflow:
messy capture → timeline evidence → root causes → "fix this next"
This is for you if:
- you want performance work to feel decisive
- you want a second set of eyes on your profiling data (without hiring a senior dev to sit behind you)
- you're trying to hit 60/90/120 and your budgets don't care about your feelings
What you'll learn inside:
- how to do one clean capture that agents can actually help with
- how to force the analysis to cite Timeline evidence (no vibes, no "maybe try…")
- how to extract a prioritized suspects list (thread + marker + why it's expensive)
- how to turn that list into next experiments so you stop thrashing
One expectation to set upfront: this is profiling-first. It makes the profiling step fast and repeatable so the actual optimization work starts with the right target. It won't magically optimize your game for you (next module covers that).
CEO/Producer translation: unstable frame time is a retention leak. Stutter costs reviews and UA efficiency.
Stop doomscrolling Profiler bars. Get the repeatable workflow → unlock the module below.