Myth: “Average FPS tells me if the game feels smooth to the players.”
Reality: Averages hide hitches. Percentiles and live overlays expose them.
In the previous post, we covered Superluminal for Unity, Fast Hot‑Path Hunting with Filters & Histograms, read it here.
TL;DR
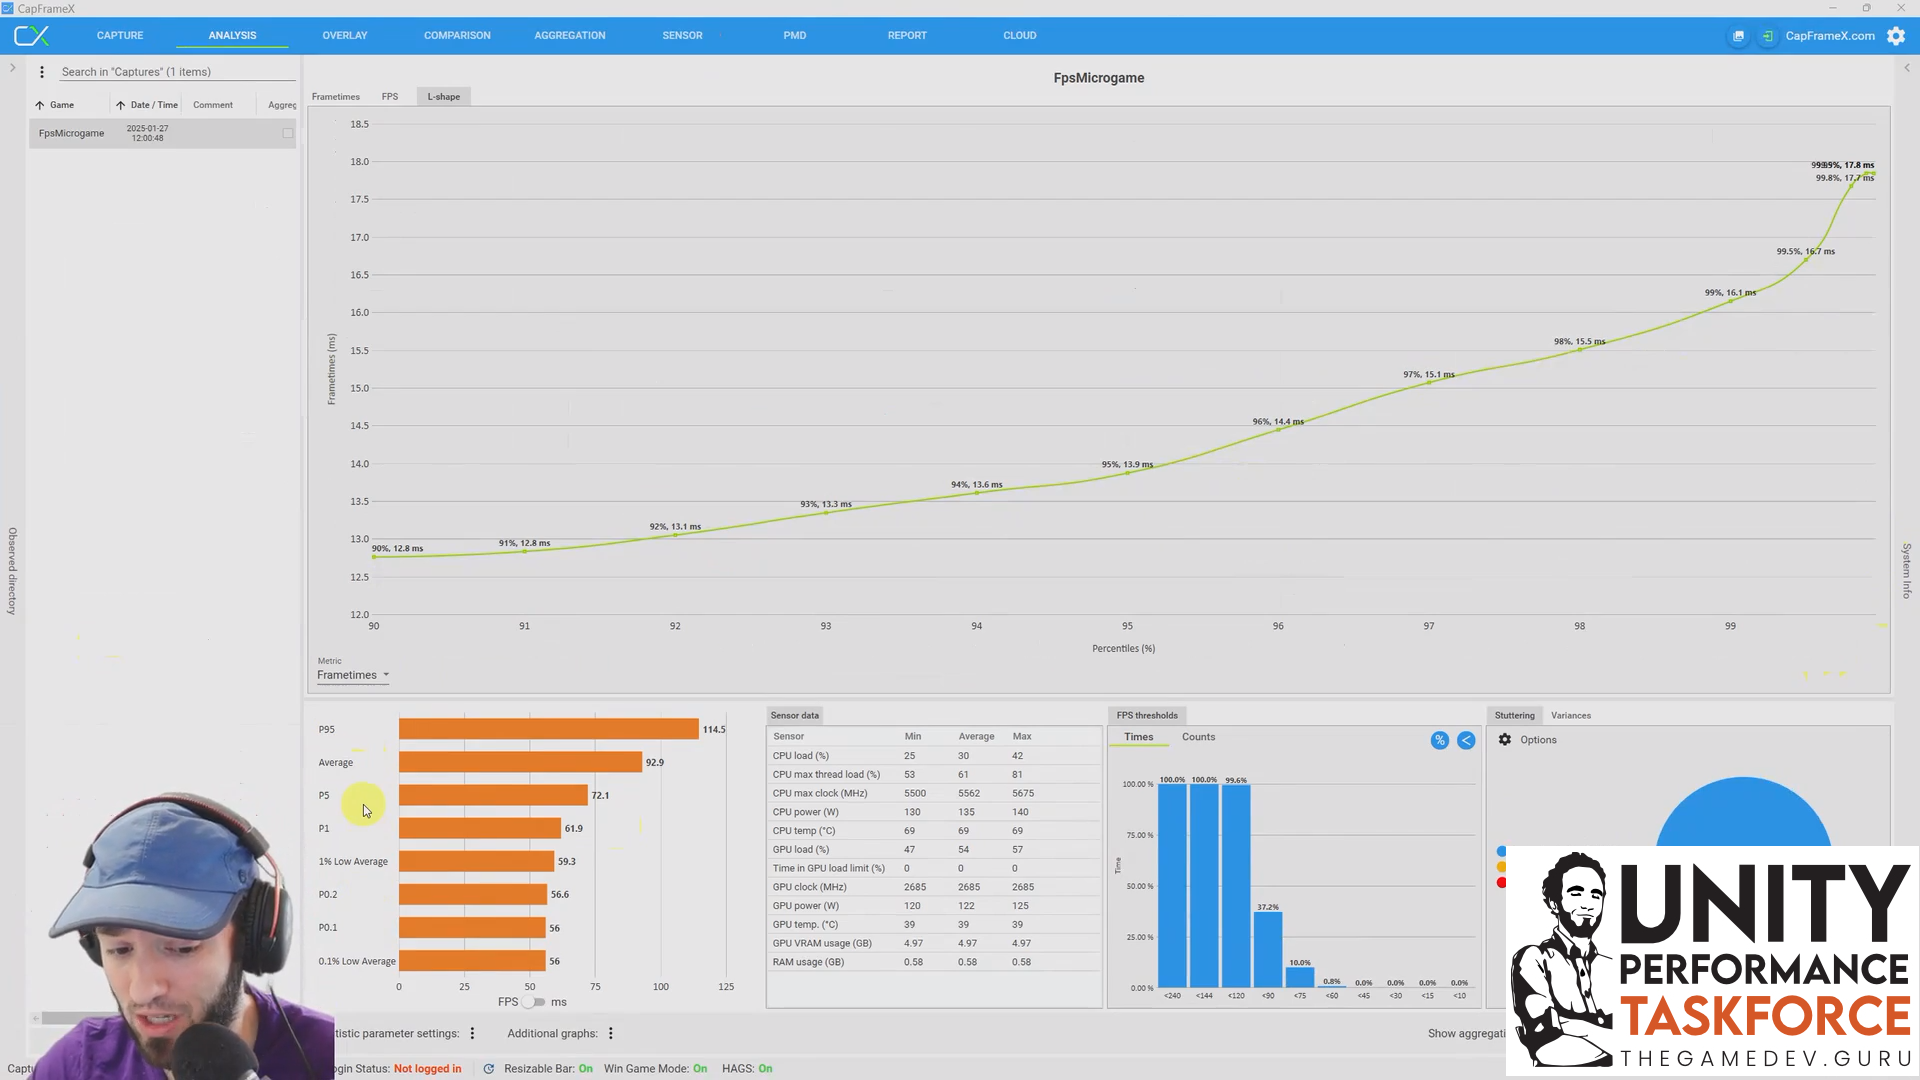
- Track percentiles, not just averages. Lower‑tail percentiles tell you if micro‑stutters are ruining feel.
- Overlay everything. Keep a live HUD while you play so spikes line up with exact gameplay moments.
- Make it repeatable. Export CSVs and plot them in your pipeline so the whole team sees pacing regressions daily.
Why this matters
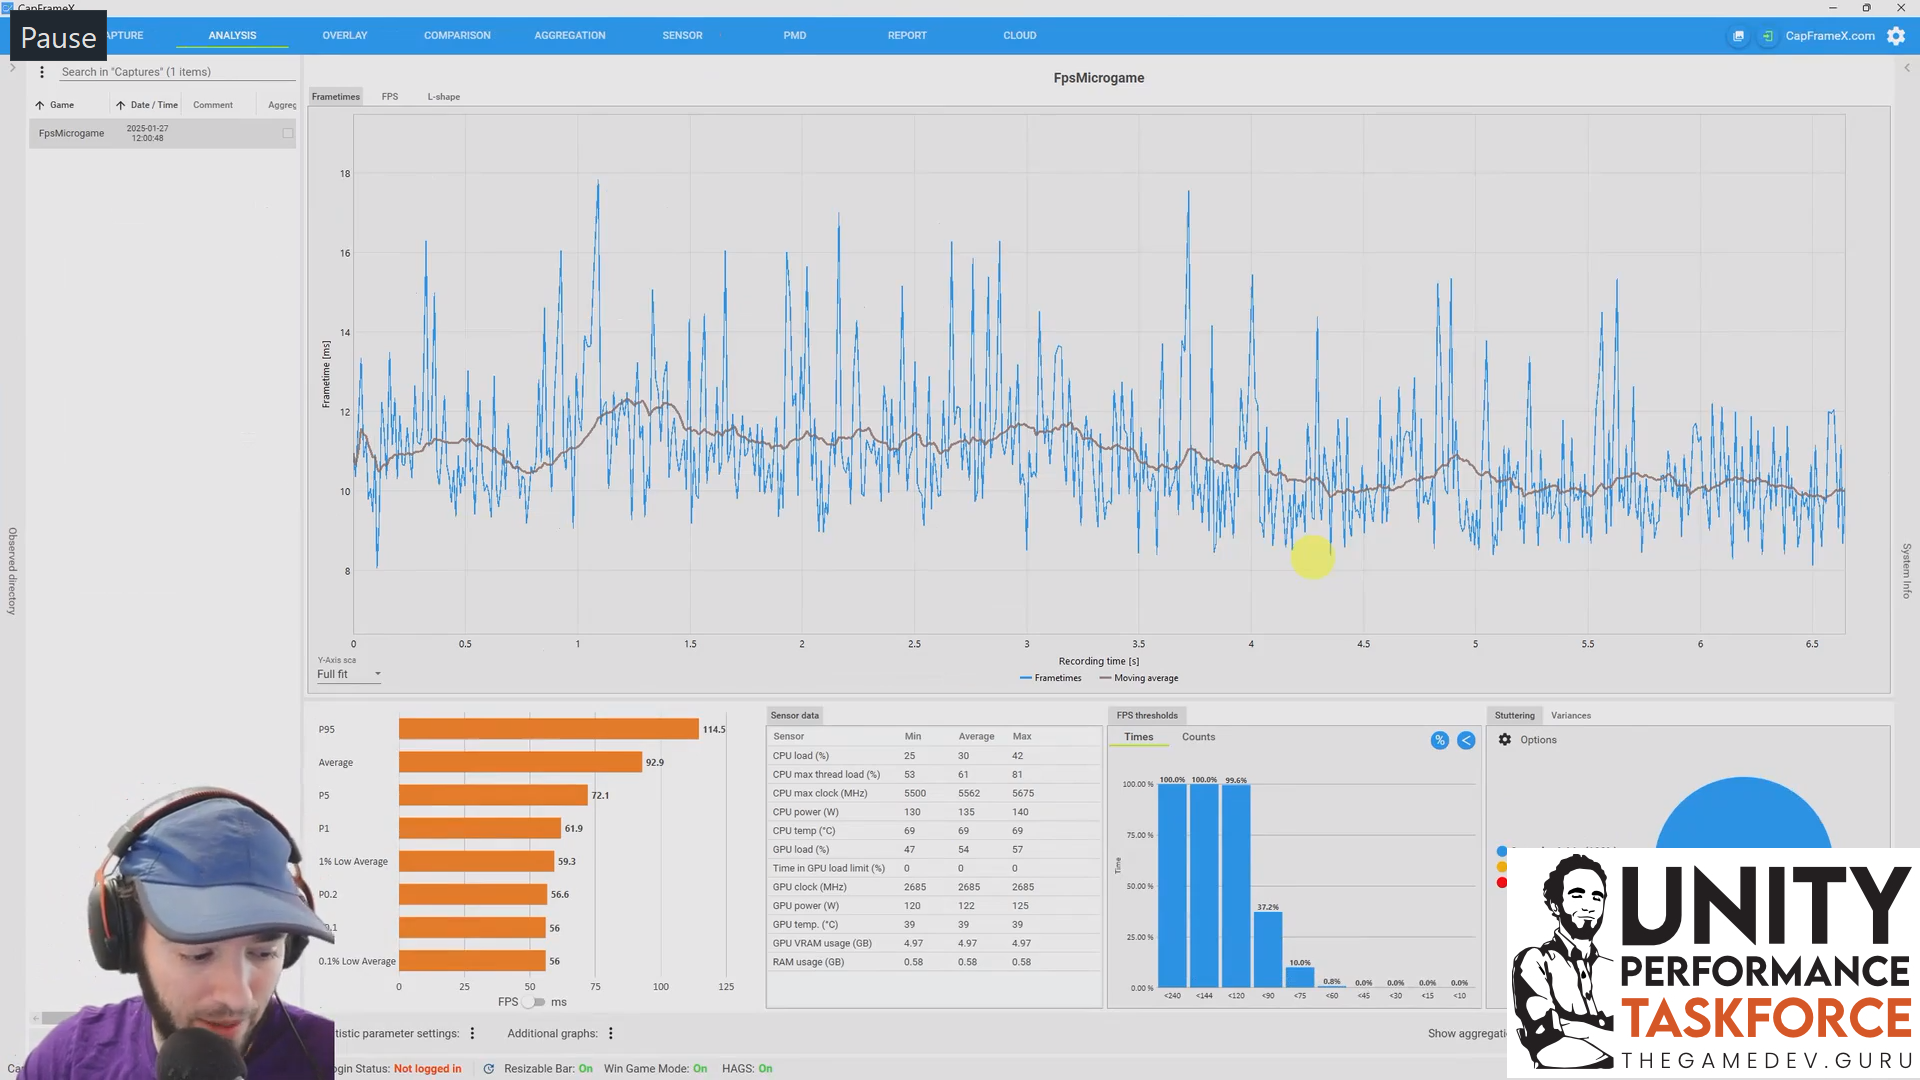
If your measurements stop at averages, you’ll miss the tiny stalls that players feel. CapFrameX and PresentMon are player‑side tools: they show frame‑time distributions and let you overlay key metrics during real gameplay.
Business line: Smoother pacing boosts session length and player spend by keeping friction low.
QA reports “hitches near the boss arena,” but your average FPS looks fine. You turn on an overlay, replay the arena, and watch a frame‑time tail stretch at the exact moment new assets stream in. Now you can tie a moment to a metric and move to root‑cause analysis.
Mechanics, why percentiles & overlays win
- “This gives you very interesting metrics, statistical based metrics about, in this case, the frame times.”
- “We care more about the lower percentiles.”
- “The overlay is something that I hugely suggest you use because it's just another tool”
Percentiles summarize the distribution: they describe how often frames exceed a threshold, not just the mean. A smooth game keeps the lower‑tail percentiles within your frame‑budget target.
Overlays attach those numbers to what’s happening on screen so you can say where and when a hitch occurs.
For deeper pacing strategy, see: Optimized Frame Pacing: Smooth Gameplay.
The Blueprint: field‑guide workflow
1) Capture a representative run (CapFrameX or PresentMon)
- Launch your game build and record a segment that includes the problem area.
- In CapFrameX, open Analysis to view frame‑time and FPS tabs, distributions, and percentile readouts.
- In PresentMon, enable the overlay to visualize a time series of frame times during play.
2) Read the distribution, not just the line
- Use the distribution/L‑shape view to see tail behavior.
- Confirm whether spikes correspond to content loading, GC, scene changes, or heavy effects.
3) Connect metrics to moments with overlays
- Turn on an overlay and replay suspect paths (arena entrances, explosions, scripted sequences).
- Note the timestamps where the overlay shows a surge, clip those sections for engineering handoff.
4) Automate the feedback loop
We recommend you automate this every single time, for all your production projects. We have done this over and over again for our consulting clients and ROI is solid.
A simple pipeline:
- Scripted playthrough (recorded input) runs on a build machine.
- PresentMon/CapFrameX records to CSV.
- CI job parses the CSV and emits charts (PNG) of frame‑time distribution and tails.
- Team receives a daily email with plots; regressions trigger investigation.
Gotchas & guardrails
- Overlay ≠ diagnosis. It shows when/where, not why. Use it to hand off a precise repro to CPU/GPU tools.
- Hardware variance. Treat sensors (clocks/power/fans) as hints; rely on frame‑time distribution for truth.
- Representative play. Capture the real path players take; sandboxes can hide stutters.
- Editor vs Player. Measure in a player build; the Editor has different behavior.
- Don’t chase averages. Keep focus on tails, what players feel.
From “where it hurts” to “why it hurts”
Once you’ve pinpointed the moments, move to root cause:
- CPU side: check scripts and engine paths with a sampling profiler (Very Sleepy / Superluminal).
- GPU side: audit pipeline state and work/wait with a GPU profiler (next post).
In the next post, we dig into GPU Reality Check , Radeon GPU Profiler for Unity Pipelines , read it here.
Optimized frame pacing without guesswork?
Book a consulting call with us and ship smoothly
I’ve seen teams transform vague “feels choppy” into crisp, plotted wins the whole studio understands. Want to know how? Reach out to us. Ruben (TheGameDev.Guru)