In this blog post, you'll learn how to measure your assembly compilation times.
Using this specific tool will show you exactly what is making you wait every time you change your code.
And guess what happens when you know who's slowing you down?
Well, once you uncover these time robbers you'll be able to do something about them.
Why Your Iteration Times Suck
You change a line of code and go back to the editor, only to wait a whole minute before you can continue working.
What's happening here?
Whenever you change code, Unity has to completely recompile and reload the affected assemblies.
An assembly is just a collection of code.
That is, structures, classes that can also reference other assemblies.
Here are some typical assemblies:
- Assembly-CSharp.dll: the portion of your game code that isn't using custom assemblies
- Assembly-CSharp-Editor.dll: your editor extensions
- UnityEditor.UI.dll
- Unity.TextMeshPro.dll
- ...
Luckily, you don't have to recompile all of them every time.
Unity is smarter than that.
But still, as your project grows, you'll have a bigger code base that makes compiling your assemblies take longer.

And the result of this is a sad developer.
Sad because you'd rather keep working on your game but instead you are waiting and losing focus.
In this blog post, I'll show you how to measure your assembly compilation times.
Next time you hear "That's Unity, you'll get used to it", you'll be able to say "No, thank you. I'll do something about it".
How to Measure Your Iteration Times
To measure your iteration times I can recommend you two options:
- The Editor Iteration Profiler (EIP).
- The Compilation Visualizer.
I already showed you the Unity Editor Iteration Profiler (EIP) in a previous post. That's a great tool to get the exact times each editor operation spends while iterating on your game, such as starting playmode, compiling assemblies, etc..
However, I recently found a second contender called the Compilation Visualizer by NeedleTools.
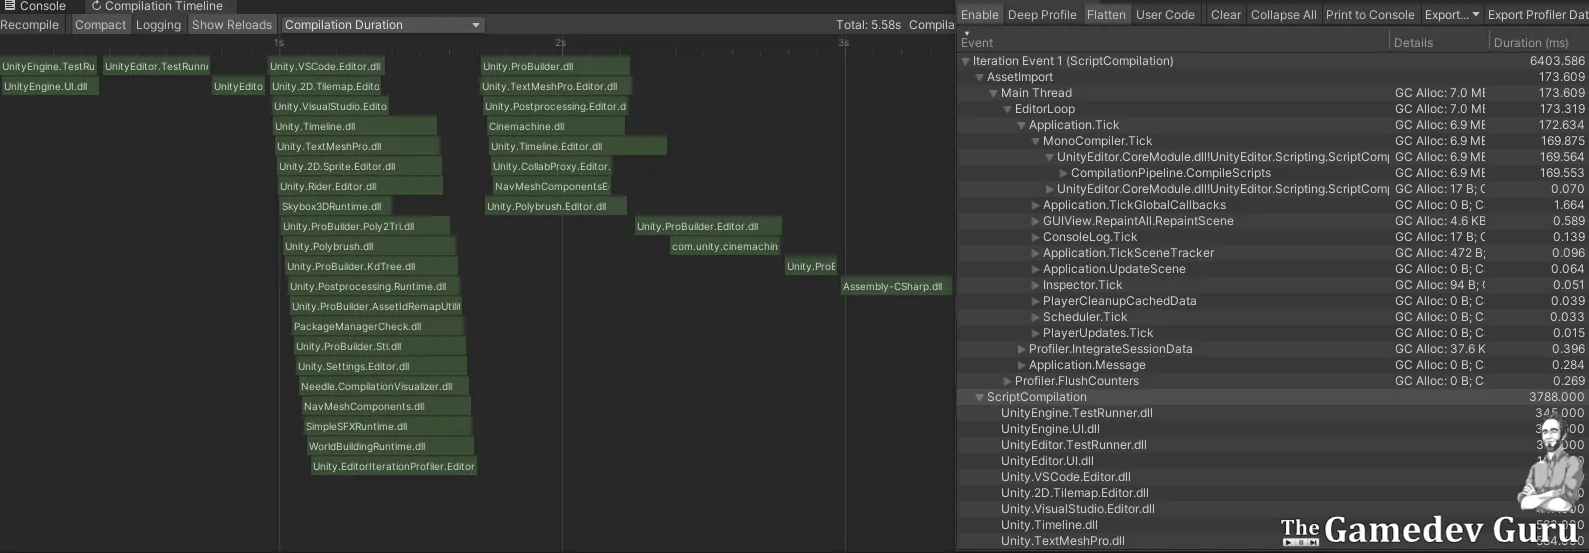
This tool is great because it displays the assembly compilation times of your project in a graphical way.
And not only that, it shows you the inter-dependencies that makes it impossible to compile ALL your assemblies in parallel.
Check the screenshot below to see both Compilation Visualizer and EIP in action.
Do you like it?
So let's see how you can get started with the Unity Compilation Visualizer.

Intro to OpenUPM
The first thing you have to do is simple: get comfy with OpenUPM.
OpenUPM is the Open Source Unity Package Registry, which is basically a collection of free packages the community has built over time.
The installation is straight-forward:
- Install npm
- In a console, type:
```plain text npm install -g openupm-cli
With that, you have _openupm_ ready to help you in your endeavors.

Let's start using it.

<p><img src="https://new.thegamedev.guru/content/images/2026/02/needle-tools-1.webp" alt="Needle Tools" loading="lazy"/></p>

### Compiler Visualizer Package Setup

The next step is to add the Compiler Visualizer package to your Unity project.

In the command line, change directory to your project root, e.g.:

```plain text
cd c:\MyProject
And there, add the Compiler Visualizer package like this:
plain text openupm add com.needle.compilation-visualizer
That's it.
Now you have this new package in your project.
Next step: using it.
Using Compilation Visualizer
Open the interface of your new toy by going to Window → Analysis → Compilation Timeline.
And then, try it by pressing the Recompile button.
You'll see the time Unity spends recompiling all your assemblies, plus the dependencies between them.
Next time you change your code, you'll see new updates come in.
Have a look at the sample below.
By the way, the author has updated this tool to work with Unity 2021.
Why am I mentioning this?
Because since Unity 2021 we have a completely new build pipeline. And that lets you open traces in Chrome like this.
Get the Unity Performance Checklist
Sign up to access the checklist and companion resources in your members area.
Already a member? Open this resource.
What's Next?
Big thanks to @hybridherbst and @NeedleTools for creating this tool, plus karljj1 and angularsen for the original idea.
If you want more tips on Unity Game Performance, make sure to download my Unity Performance Checklist.
With over hundred of simple tips, you'll get your game to the frame-rate your players desire.
Ruben (The Gamedev Guru)