
In this post, I'll show you how to know if your game performance is suffering from too many Unity Draw Calls and what to do about it. You'll be able to answer:
- What is a draw call and what will they do to your players?
- How do you know if you have too many draw calls?
- How can you reduce these dreadful Unity draw calls?

1. What Are Unity Draw Calls?
Put it simply, draw calls are commands the CPU sends to your GPU to draw geometry on your screen.
- The CPU knows what is to be drawn. After all, that's what your Unity scene contains.
- At the same time, your GPU hows how to draw it.
The bridge between CPU and GPU that gets your scene rendered are the draw calls.
Think of draw calls as Unity saying "draw this here, draw that there".
And here's what happens with draw calls: the more of those you have, the more overhead you're putting on your CPU.
The reason is simple: preparing and submitting draw calls is expensive for your CPU.
Your CPU has to transform your scene into a data format that your GPU understands. This process takes a considerable number of CPU cycles and memory bandwidth (RAM + VRAM).
So if you have too many draw calls, you are leaving your CPU with no budget to execute your scripts or other important parts of your game. And this will end up lowering your framerate (and your game reviews).
So, how do you know how well (or bad) are you doing?
2. Do You Have Too Many Draw Calls?
As a game developer, you have access to different tools that help you kind of guess if you're draw call bound.
One tool is guesstimating.
2.1. Guesstimates
Guesstimates is about following some simple numbers as general guidelines and then dig into the specifics.
Let me share my secret magic numbers with you:
- On mobile, aim to have less than 200 draw calls.
- On desktop, aim to have less than 2000 draw calls.
Those are for low/medium specs, so feel free to alter them depending on your target hardware.
How do you find the number of draw calls you have? Here, check this image:
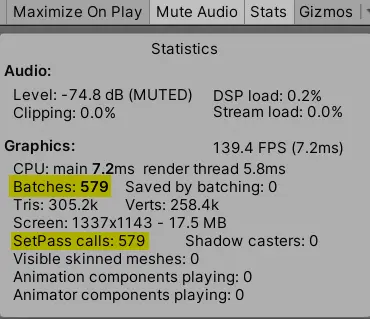
Within the Unity game tab, you have access to the stats panel. There, you can see two relevant values:
- Batches: what we traditionally understand by draw calls
- Set Pass: metric that represents "how many of these draw calls are especially expensive"
If you are below the magic numbers I gave you, chances are you'll be fine.
But even if your numbers are above the soft limits I wrote, you might still be fine.
Why?
Because it all depends on how you distribute your performance budget.
The more you optimize in draw calls, the more room you have for your scripts (and the other way around).
2.2. Unity Profiler — Main Thread, Render Thread
If you attach the Unity profiler to your player build, you'll get a more accurate picture of where you are standing.
While this might look easy, there are many pitfalls when interpreting the numbers the profile gives you. This is because Unity does many optimizations that makes interpreting results less straight forward, such as jobs and multithreaded rendering.
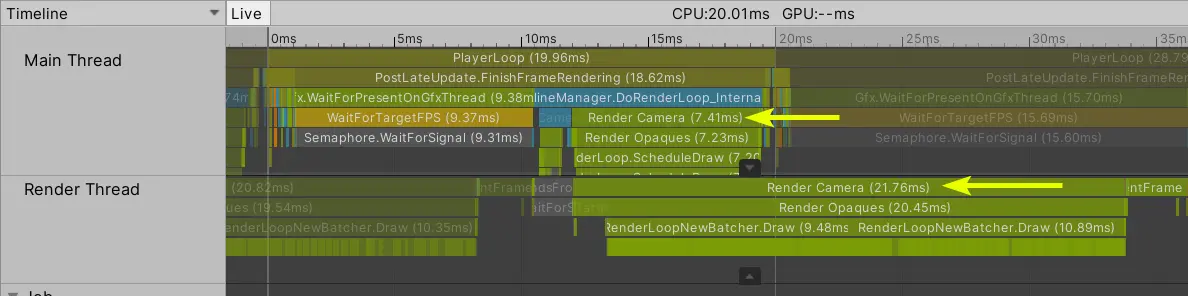
The general framework I'll give you is to check the following two sections:
- In your Main thread: the cost of your rendering section.
- In your Render thread: the cost of the whole frame.
Generally speaking, the main thread rendering section is mostly about generating the high level rendering commands (RCMD). Unity then queues them in a buffer for the render thread to process.
The render thread then translates these commands into low level graphics commands (GCMD) that the GPU driver understand.
That's why it's important to analyze both sections on the profiler.
Here's an example to illustrate my point.
First, you have to determine your performance budget. You do this by dividing 1 by your target FPS, e.g. 1/60 = 16.67 milliseconds.
Then, this is what I would recommend you achieving in the profiler:
- Main thread: get your rendering cost under 5 ms or a third of your budget.
- Render thread: do not exceed your total budget, e.g. 16 ms.
Again, it all depends on how you decide to distribute your performance budget. But these numbers have served me well.
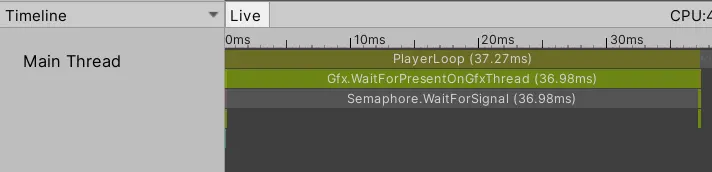
The last thing I have to say about this section is: be careful when interpreting the markers. Some might indicate that your thread is just waiting for something else to happen.
For instance, the WaitForPresentOnGfxThread marker means that your CPU is waiting on your GPU to finish rendering. So your bottleneck could be somewhere else other than real CPU work.
If your platforms allows you, reduce the game resolution to 20% to eliminate most GPU bottlenecks. This will make your life easier when profiling for draw calls.
2.3. A/B Testing
The third option I have for you is to just reduce draw calls and see if your framerate increases.
You could, for instance, temporarily mark your objects static and hope that you get less draw calls through static batching.
If your performance increases after reducing draw calls, that's a strong indicator your game is CPU bound.
Sure enough, doing this test takes time, because you have to do this optimization in the first place.
And this brings me to the last point...
How the hell do we optimize draw calls?
3. How to Reduce Your Unity Draw Calls?
Shortly put:
Reduce the number of unique materials in your scene
Different materials breaks batching, so having less of them will automatically reduce your game draw calls.
There are several techniques to reduce your material count, such as texture atlasing and color palettes.
I won't go in detail on that because... I already did in another post.
So, if you think you're draw call bound, then I invite you to read my Unity Draw Call Optimization master post.
By the way, I'll be hosting a live QA on game performance in about an hour. If you're reading this, you probably won't make it on time, but make sure to subscribe to join the next one.
~Ruben