Welcome to 2025, where our digital projects are still bogged down by inefficiencies.
Today, we’re diving into a performance topic I haven’t publicly covered yet: sampling vs instrumentation profiling.
Let's get to it.

The Two Faces of Profiling
Imagine a long road trip with the typical chatty child in the backseat. Every five seconds: "Are we there yet?"
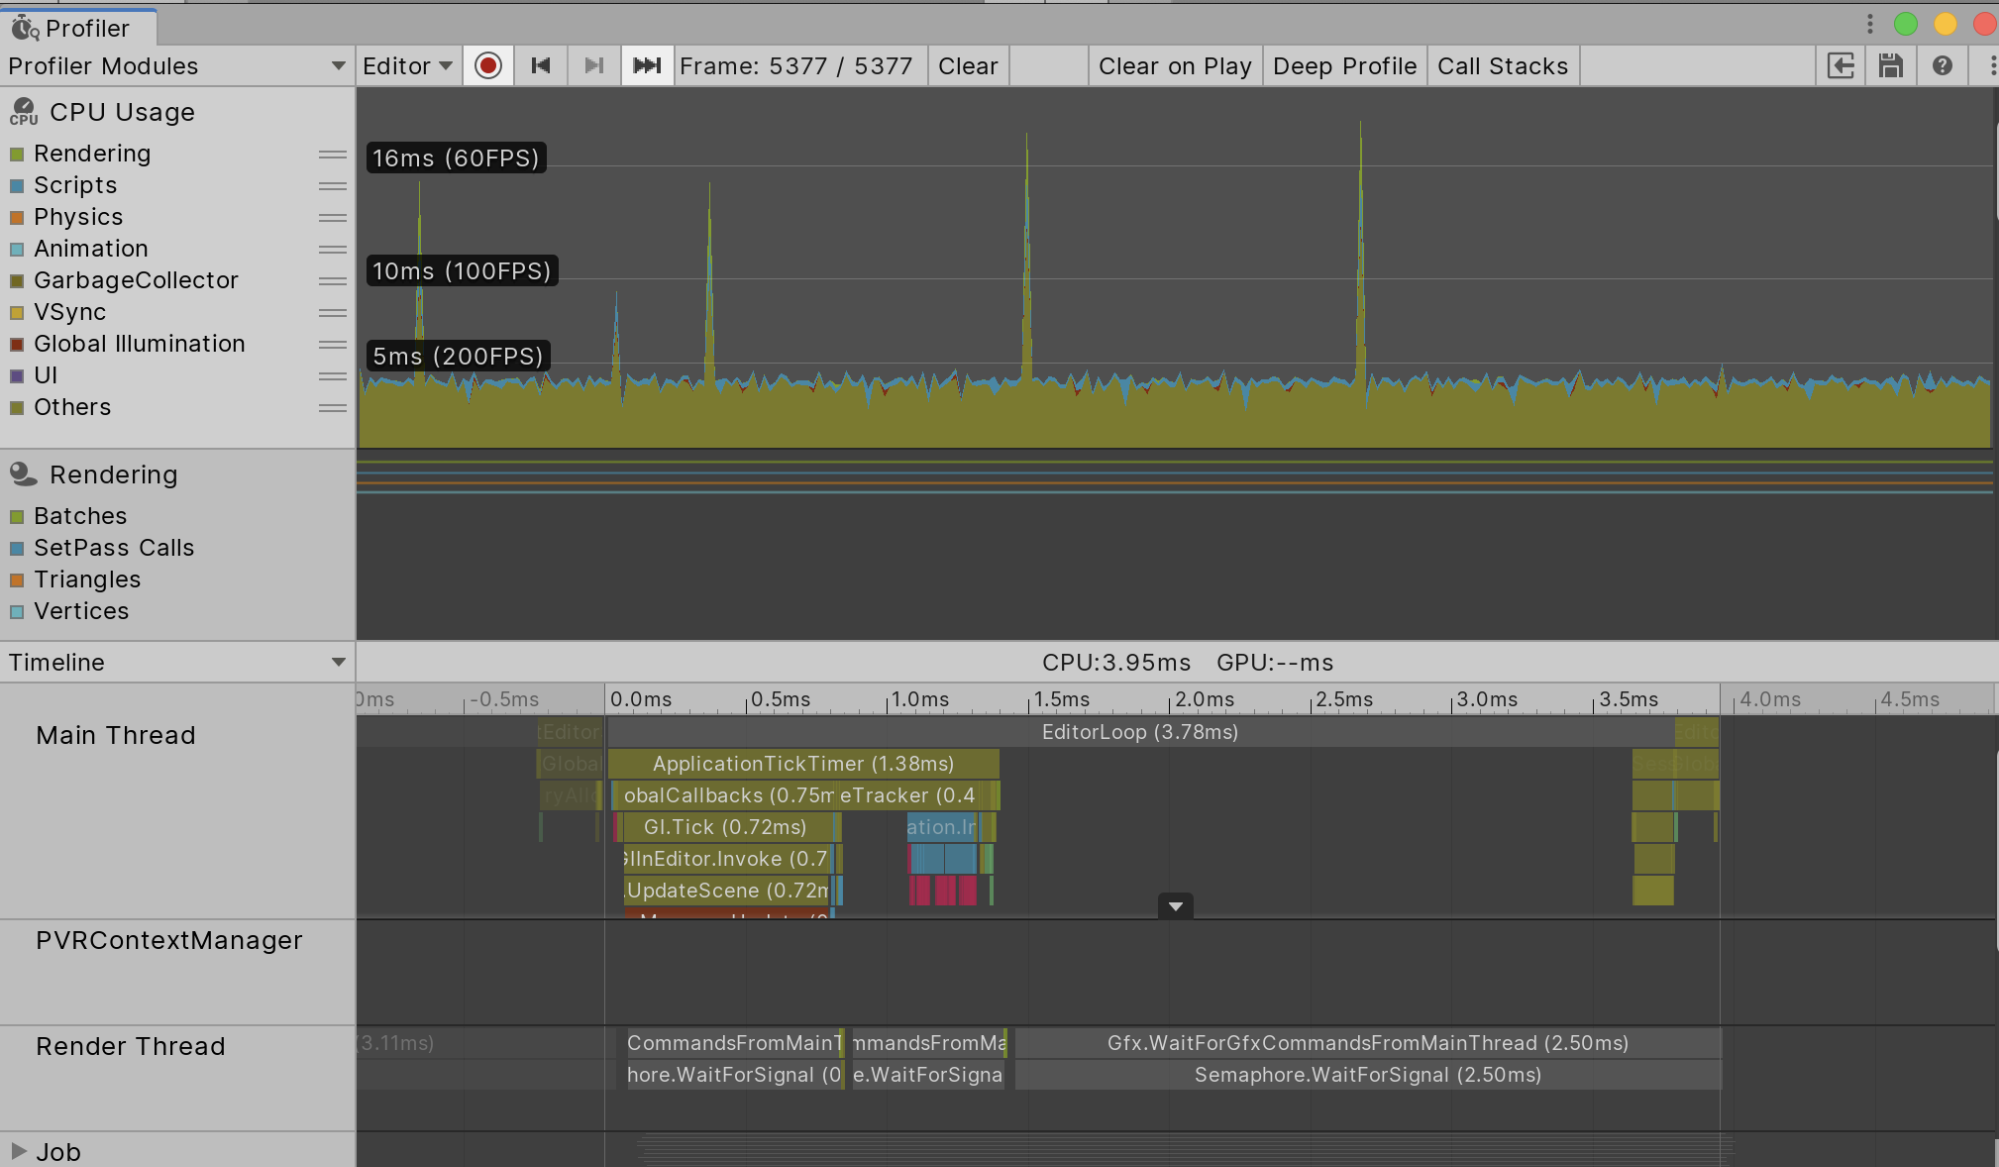
This is still what we do in 2025 with our games with the so-called sampling-based profiling: periodically checking where your code is spending time. On the flip side, instrumentation-based profiling is like installing a high-precision speedometer that logs every twist and turn along the journey.
This duality isn’t just academic; it’s a real-life battle between precision and ease-of-use.
In my early days, I assumed the Unity Profiler’s auto-magical markers would catch every hiccup. But nope. Soon after I discovered that sometimes you need to explicitly mark sections of code to really understand what’s eating up your game performance.

Sampling vs Instrumentation: A Quick Breakdown
Instrumentation-Based Profiling
- What It Is:
You manually insert measurement calls (thinkProfiler.BeginSample()andProfiler.EndSample()) around critical sections of your code. - The Upside:
Precise timing for code blocks you care about. - The Downside:
It requires you to modify AND rebuild your code, and if you miss a spot, the profiler won’t tell you what you didn’t measure.
Sampling-Based Profiling
- What It Is:
The profiler takes periodic “snapshots” of where your code is executing. - The Upside:
It’s non-intrusive—no need to sprinkle measurement calls all over your scripts. - The Downside:
You might miss extremely short-lived functions if the sampling interval isn’t fine enough.
This is why sampling-based profiling will be your secret weapon against hidden performance bottlenecks.
Road Trip Profiling 🚗💨
Continuing with the previous analogy...
You’re on a family road trip. Instrumentation profiling is like having a co-pilot who writes down every single maneuver you make, while sampling profiling is like snapping a photo of your location at regular intervals. Both give you insights, but each has its quirks. Just as you wouldn’t blame your co-pilot for every bump in the road, don’t expect your profiling method to reveal every nuance of your engine’s inner workings without some clever detective work.

Quick Cheatsheet for Profiling
- Choose Your Tool Wisely:
Use instrumentation when you need pinpoint accuracy in critical functions.
Use sampling to get a broad view of where performance issues might be hiding. - Combine & Conquer:
Don’t be afraid to use both methods in tandem. Instrument your key functions and sample the rest. - Mind the Overhead:
Remember, every profiling call adds a little extra work. Balance your need for data with the performance cost. - Leverage the Tools:
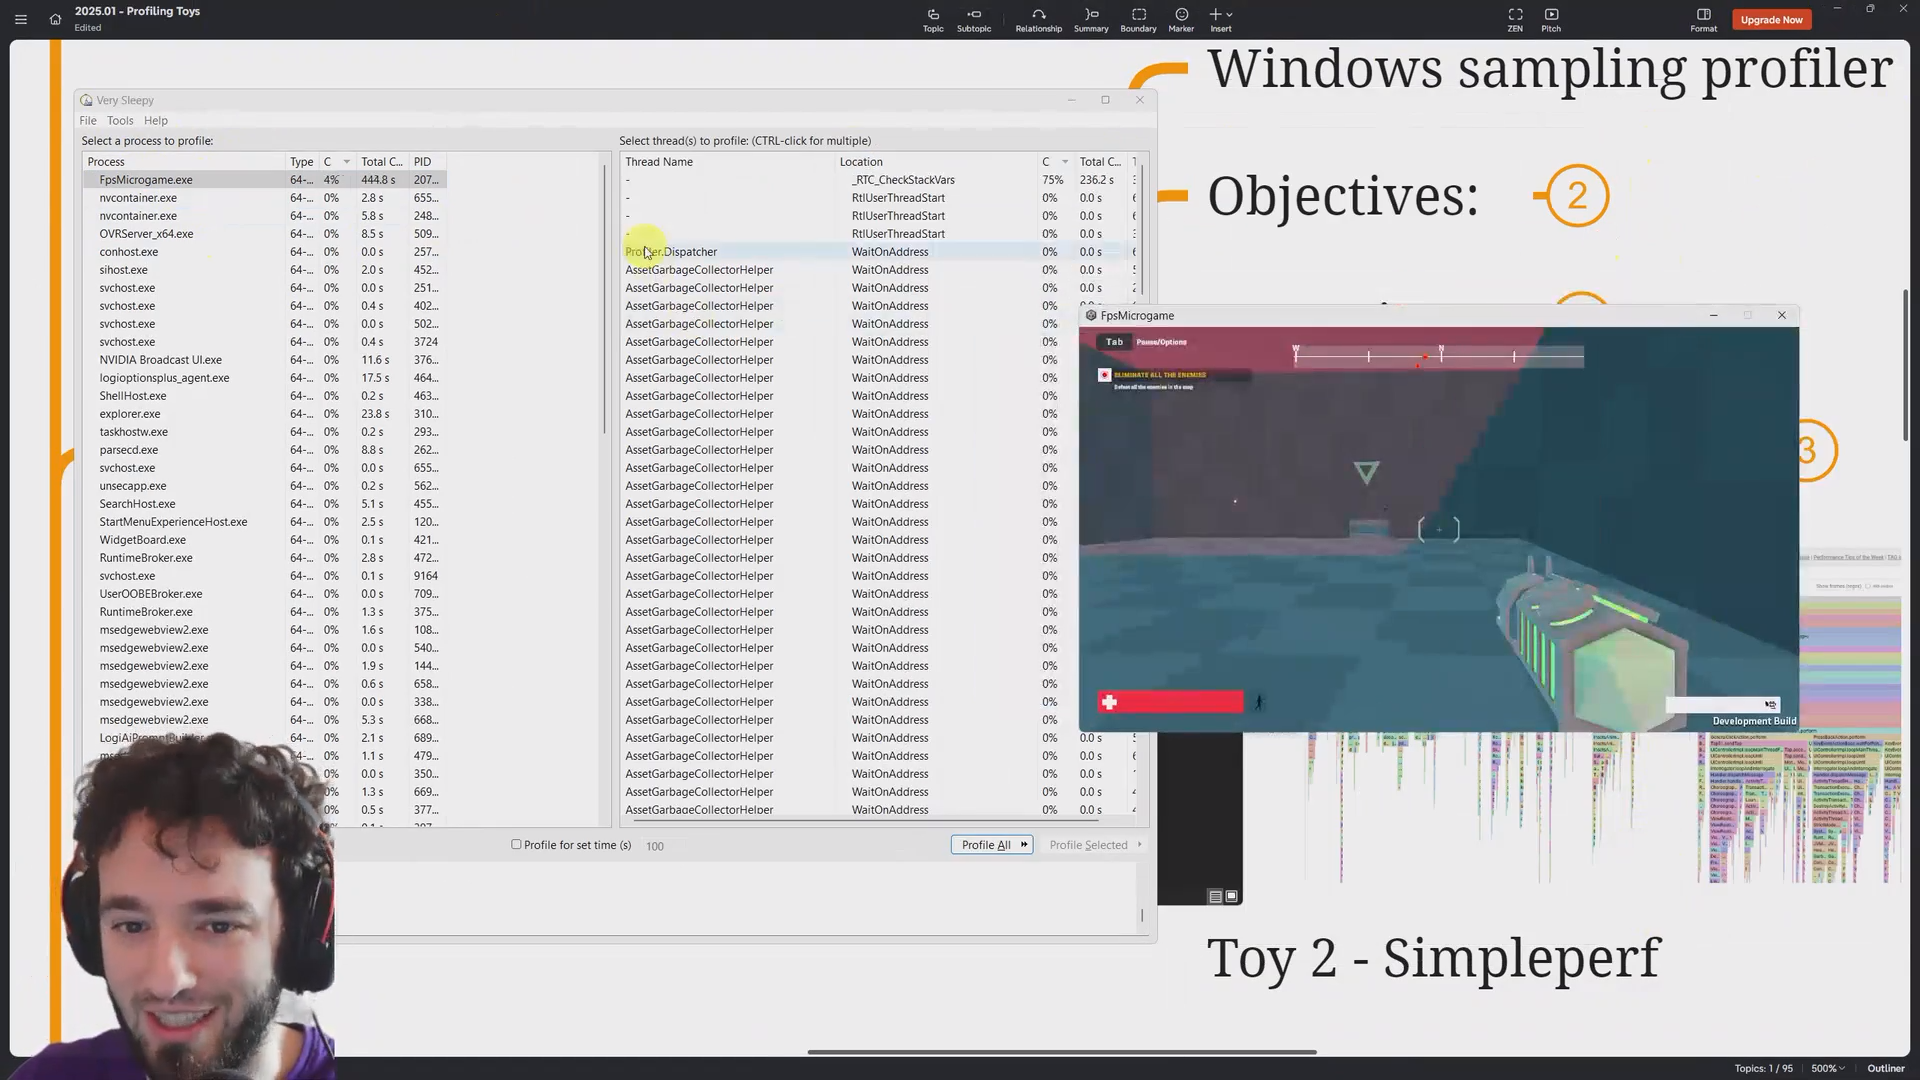
Explore tools like Very Sleepy (for Windows) and Simple Perf (for Android) to get that extra layer of insight.
Very Sleepy is one of the tools I teach in the Unity Performance Taskforce module on "Six Exotic Profiling Toys to Know About".
Here’s a little pseudocode snippet to illustrate the decision flow:
if (useSamplingProfiling) {
    startSampling();  // Periodically capture call stacks
    processGameplay();
    processGraphics();
} else {
    instrumentStart();  // Mark the start of a critical section
    processGameplay();
    instrumentEnd();    // Mark the end and log time taken

    instrumentStart();
    processGraphics();
    instrumentEnd();
}
Navigating the Call Stack Maze
Circling back to sampling-based profilers...
As you dig deeper (indeed it may feel like a labyrinth), you’ll come across the inclusive versus the exclusive times. Which is closely related to the current call stack.
The callstack, by the way, is just about which function calls which function, i.e. the callers and callees.
And here you'll see an extensive list of functions... some from Unity’s inner engine and some from your own code. Thanks to sampling-based profilers, you'll come across surprising Unity internals you never thought to exist (mostly because Unity hides them away from you). And this will give you a solid, juicy edge during development.
That is, only if you load the PDB symbols correctly.
Yes, no surprise here. Learning to navigate this jungle is part of the performance detective work.
As we explore in the Unity Performance Taskforce, even the most baffling call stacks hide the clues you need to optimize your game.
Wrapping It Up
In our journey today, we uncovered the twin pillars of Unity performance profiling. Whether you’re meticulously instrumenting your code or casually sampling it, remember: the goal is to illuminate those dark, hidden corners of your game where performance issues lurk. Keep your curiosity alive, and don’t be afraid to dive into the engine’s depths!